Another Look At NFL Positional Value
Like any good overzealous NFL fan, I’m spending a lot of time these days thinking about the upcoming NFL draft in April—undoubtedly too much time. One of the things I’ve been toying with lately is finding ways to assess which positions to target in the draft, ignoring the prospects of individual players—what I’ve been calling “positional value.” I previously looked at positional value from a money standpoint by looking at which positions teams focus their salary cap spending on. From that vantage point, it’s apparent that quarterbacks take home the lion’s share of team spending, with edge rushers a distant second. Wide receivers, defensive tackles, offensive tackles, and cornerbacks are the next tier, while other positions like center, running back, tight end, and off-ball linebacker are clearly not valued as much and net much smaller contracts.
But there are of course other ways to look at positional value, so I wanted to talk through some of them.
Which Positions Do Teams Actually Prioritize For Their Best Draft Picks?
One thing I wanted to look at is when teams actually draft particular positions. The NFL draft has seven rounds, so we can try to assess positional value by looking at which positions typically get drafted higher in the draft. It’s a relatively simple task in concept, but there are some things I had to clean up to get good positional groupings since teams may draft a player who played one position in college intending for them to play another role at the pro level. For example, a fair number of college cornerbacks get drafted with the expectation that they’ll ultimately play safety in the NFL; same thing for college tackles who may profile physically as NFL guards.
Using info from Pro Football Reference, I pulled every draft pick from the last 10 drafts and categorized each player (excluding pure special teamers like kickers, punters, and long-snappers) into the following positions: quarterback, wide receiver, tight end, running back, offensive tackle, offensive guard, center, edge rusher (includes defensive ends and 3-4/rush linebackers), defensive tackle (aka interior defensive line, same thing), linebacker (off-ball), cornerback, and safety.
There are a few house-keeping items I wanted to acknowledge off the jump, specifically regarding how I selected player’s on-field positions as of the time they were drafted.
I checked what position each player in fact played during their first few years in the NFL to confirm they were slotted correctly. For example, I categorized Micah Parsons as an edge rusher even though he played off-ball linebacker in college, as Dallas moved him to edge rusher in the summer leading up to his rookie year. This is obviously an imperfect way of handling things, and there is some degree of my judgment baked in. I did my best, and I’m happy to email anybody the list of positions I used for each player if you’re curious.
I chose not to divvy up positions further than the categories described above. That was deliberate. I didn’t draw distinctions between left and right offensive tackles and offensive guards, as those positions shift a lot from where guys play in college, or even from where NFL teams initially hope they will land—quite often, players drafted in the hopes they will eventually be left tackles or left guards often move to the right side if their skill sets are better suited there or if a greater need develops on that side of the line for a particular team.
I also didn’t draw any distinctions between slot, X, and Z wide receivers, nor any distinctions between boundary cornerbacks and nickel/dime cornerbacks. Players often switch between those roles in different coaching schemes after they’re drafted, and it’s really tough to get reliable data at scale. I note this just because conventional wisdom suggests that left tackles/guards are more valuable than right tackles/guards, X/Z receivers are more valuable than slots, and boundary corners are more valuable that nickel/dime corners. I don’t dispute any of that, but it’s more than I set out to address here.
Finally, I chose 10 years of draft data on purpose, though I admit it’s a bit arbitrary. Things change quite a bit in the NFL over time, and I didn’t want to go so far back that it would mask current trends. For example, 20 years ago, running backs were highly sought after, but it is pretty evident that is no longer the case. Going too far back into the past runs a very real risk of including too much historically dated information to make any analysis about the current NFL useful. On the flip side, I also didn’t want such a small time period that it would be impossible to draw any meaningful conclusions from having too small of a dataset. Thus, 10 years seemed about right.
So, where are teams spending their picks?

[Figure 1]
Figure 1 shows the percentage of players drafted in each round for the 12 positions I looked at over the course of the last 10 drafts, from 2014 through 2023, as well as the total number of players drafted at each position (at the bottom in parentheses).
There’s a fair amount that can be seen from this chart, but I want to focus on what I found most notable in particular.
A very high percentage of drafted quarterbacks (almost 28%) are drafted in the first round, but there’s a relative dearth of quarterbacks taken in the second round (under 7%). At the same time, there isn’t really anything notable about the proposition of QBs getting drafted in rounds 3-7. That suggests QBs who aren’t quite first round talents are often getting pushed up from the second round. That does appear to happen—for example, the Ravens and Vikings traded up from the second round to the very last pick in the first round to draft Lamar Jackson in 2018 and Teddy Bridgewater in 2014, respectively. Surely this trend is in part because teams can also secure a fifth-year of team control for first round picks, which can lead to significant financial value for the team if the player winds up being successful, especially for QBs.
After quarterbacks, teams appear to select a high percentage of their offensive tackles and edge rushers in the first round. Over 19% of drafted offensive tackles and nearly 18% of drafted edge rushers are taken in the first round. That makes sense given the premium teams place on these positions in free agency. Also, for offensive tackles in particular, there may be a similar trend of players getting pushed up from the second round to the first round as with QBs, although it’s less pronounced—there’s a big drop-off from the percentage of players taken in round 1 to round 2 compared to other positions.
Just like with free agency spending, teams do not want to spend up, in terms of early draft capital, on low-value positions in free agency like tight end and running back. Only about 18% of drafted running backs and 20% of drafted tight ends are taken in the first two rounds. A similar trend occurs withs with drafted guards (about 20% taken in the first two rounds) and linebackers (about 17%). I was a little surprised to see how low the percentage of guards taken in the first two rounds was. Even though it’s not a “high value” position, it’s still higher value than RB, TE, and LB.
Teams appear to use a high proportion of middle round picks on the lower value positions I just described. Around 54% of tight ends, 50% of running backs, 55% of guards, and 50% of linebackers are taken in rounds 3 to 5 —tight ends, running backs, guards, and linebackers. Compare those numbers to quarterbacks and offensive tackles, centers, and cornerbacks, where around 39% to 41% are taken in the middle rounds.
There’s a weird thing going on with centers, who teams appear to typically forgo in the first round and prefer in the second round. Only 9% of drafted centers are taken in the first round, but over 30% of centers are taken in the first two rounds taken together. I am not sure there’s an obvious reason behind this trend, but it definitely stands out amongst the lower value positions. This could be coincidence given the relatively low number of centers drafted compared to other positions.
I was surprised to see that wide receivers and cornerbacks are pretty evenly drafted through the seven rounds. They’re among the highest value positions in the free agency market, so I would’ve guessed that teams were drafting them more frequently in early rounds. I will flag that the fact that my dataset doesn’t distinguish between slot and boundary players is probably masking some trends. In addition, it’s also worth noting that WR and CB are usually the two deepest positions on NFL rosters—most teams carry 5+ receivers and corners respectively—so it makes sense that teams have to draft a lot of them.
It’s notable that defensive tackles haven’t been drafted all that early relative to edge rushers. Only about 22.5% of defensive tackles are taken in the first two rounds compared to about 33% of edge rushers. For years, conventional wisdom has said that edge rushers are more valuable given their pass rushing role, but that weighting has changed a lot in recent years. More and more DTs are becoming elite pass rushers (Aaron Donald comes to mind), so they’re getting paid like it. The free agency spending data I looked at previously showed that DTs are the fourth highest paid position based on average annual contract value, trailing only QBs, edge rushers, and WRs. And at the top end, DTs are paid pretty closely to edge rushers—the top 20 DTs are paid about 90% of what the top 20 edge rushers get in terms of average annual contract value—so I would’ve expected edge rushers to get a slight advantage in the early draft rounds, but it’s still more than I would’ve thought.
By looking at where teams draft particular positions over time, we can get some insight into how NFL teams on the whole are valuing different positions without getting bogged down too much in individual talent evaluations. Combined with looking at positional spending, we can get a pretty decent picture of which positions are priciest in terms of dollars and assets (draft picks) in order to weigh where to allocate resources. Unsurprisingly, the two markets show a fair amount of similarities. The two markets agree that QBs are the most important position and price them accordingly (big dollars in salary, and first round pick expense in the draft). Both markets also seemingly agree that edge rushers and offensive tackles are premium positions, while RB, TE, LB, and safety aren’t. Some of the other positions present some interesting value opportunities. For example, WR and CB are expensive positions to fill in free agency, but team’s aren’t necessarily allocating their early draft picks to those positions disproportionately—that suggests there’s value to be had by drafting those positions rather than filling them with veteran talents at market prices. Centers might be the opposite—it’s a really cheap position to fill in free agency, but a big chunk of centers are getting drafted in the first two rounds.
Can You Prioritize What Positions to Draft By Looking At Production?
One of the benefits of determining the relative value between the various positions is figuring out which positions to focus on during the draft. If a given position is expensive to fill in free agency, such as quarterback or edge rusher, it makes sense that teams would benefit from filling that position through the draft where salaries are set to a rookie scale for up to five years for first round picks (four years for non-first round picks). Of course, the biggest potential values also come at the high-end of each position.
A top 10 overall NFL edge rusher can command around $25 million or more per year in average compensation, which will lead to a comparable salary cap hit (before cap manipulations to push cap hits into different years). A top 10 center is likely to command somewhere between $10-13 million in average annual compensation. Meanwhile, the #1 overall pick in this year’s draft (the highest compensated draft slot) draft will have a 2024 cap hit of just over $7 million per Spotrac. In other words, a team will save about $18 million or more in cap space by drafting a defensive end that performs comparably to top 10 edge rusher, but they would only save about $3-6 million in cap space by drafting a top 10 center. The exact amounts will vary by position and player quality of course, but the basic idea is fairly intuitive—teams save cap space by hitting on draft picks at the right positions, and they can use that cap space in free agency on better players at other positions that they don’t (or can’t) fill through the draft.
Teams realize this, which probably helps explain why some high value positions are drafted disproportionately in the first few rounds of the draft (as shown in Figure 1).
But drafting positional value also depends on some other assumptions.
One built-in assumption is that players drafted in round 1 are likely to be better than players drafted in round 2 (and so on). Put another way, players drafted higher are more likely to be good. That makes sense, and if you believe (as I do) that NFL teams are collectively good at evaluating talent, it’s a reasonable assumption.
There’s also an assumption that teams will “hit” on draft picks at about the same rate regardless of position. If you could identify top 10 centers much more often than top 10 edge rushers, for example, it would eat into the value proposition of drafting edge rushers more often and earlier than centers. But that’s a tough question to assess without looking at how teams and draft analysts rate individual players. Perhaps I’ll look into it more down the road, but for now, it’s a bigger project than I want to take on in this post.
A third assumption is that prospect quality at each position follows a relatively similar pattern. We would expect round 1 players to be better than round 2 players, round 2 players to be better than round 3 players, and so on and so forth—but what if the changes in player quality by draft round change at different rates for different positions? You can easily imagine a world where round 1 quarterbacks are great but round 3 quarterbacks basically never see the field—after all, only one QB plays at a time—but that’s much harder to imagine for a deeper position like cornerback, where 5-6 players might see playing time in a game. So I wanted to check into it here.
Draft Round vs. Production
You can imagine a variety of ways to evaluate how different positions compare with respect to performance by draft position. You could look at how many All Pro teams or Pro Bowl teams players make, you could look at counting stats like passing yards or receiving yards relative to their position, you could look at all-encompassing metrics like individual DVOA. Whatever measure you choose, they’re all going to be imperfect, especially given the wide variety of roles in football. Measuring players based on yards or touchdowns alone usually won’t work when more than half of the positions on the field will never accrue a yard or score a touchdown. So I wanted to pick a metric that is theoretically applicable to all 12 positions I cared about, and where it was reasonably possible to get the relevant data (with apologies to metrics Pro Football Focus grades, which are a pain in the butt to compile). Lucky for me, Pro Football Reference has a custom performance metric called weighted career approximate value that they have calculated for players drafted in the last 10 years (my focus) and more.
Pro Football Reference gives a full description of the approximate value (AV) metric here, but in essence, it is designed to get at the value of a particular player based on their contribution to their team’s offense or defense given the number of points scored or given up by the team, the fact that there are 11 players on the field at a time per team, and the fact that different positions contribute in different ways. The metric assumes a total number of points for a team’s offense (or defense) based on how many points the team scores (or gives up) compared to an average team, and then apportions some of those points to various position groups like the offensive line, rushers, receivers, etc., and then divvies those points up to the various players on the field. It also appears to incorporate some looser elements, such as whether players made Pro Bowls, particularly for positions that lack obvious statistical metrics like offensive linemen. It is, in effect, a composite metric designed to look at a player’s overall contributions given the context of the team they play on.
Weighted career AV (wAV) is a derivative of AV, but it looks at the total AV generated by a player over the course of their career and weights things in favor of their peak performance season (100% for the player’s best season, 95% for his second best season, 90% for his third best season, and so on). The effect of the weighting basically means that player quality is based on their athletic peak, and not weighed down as much by down seasons that may be the result of injury or their eventual career decline, but it does favor players with high peaks compared to players with sustained quality play at a lower peak. For my purposes, that’s fine. Even though wAV and AV are imperfect metrics, but they are readily available and I was able to pull them for every player in the 10 year draft pool that I looked at. Perhaps in a future post I will look at other advanced metrics like individual DVOA or Pro Football Focus grades, including as a point of comparison, but for now, wAV and AV will have to do!
Anyway, because Pro Football Reference’s wAV metric already incorporates positional differences, it shouldn’t be used to reliably compare players at different positions. That’s fine, no stat can be used for everything. While baseball has metrics like wins above replacement (WAR) that are great for that type of comparison, football’s diversity of roles and stats makes it less amenable to such all-encompassing metrics, so there isn’t anything perfect available. wAV doesn’t really fill the “WAR” role, but it can be useful to compare players within a position group (QBs to QBs, for example) while also controlling, at least somewhat, for differences in quality of offenses and other players on the team. Since I wanted to compare how players drafted early in the draft compare to players drafted later in the draft at the same position, and to see whether those differences are similar or different across positions, I had to play around with the stat a bit.
Specifically, I used the draft round, position, and wAVs for the relevant positions (quarterbacks, wide receivers, tight ends, running backs, offensive tackles, offensive guards, centers, edge rushers, defensive tackles, linebackers, cornerbacks, and safeties) to calculate the average wAV of players drafted in each round (1 through 7) by position. I used the average for each round because I wasn’t super concerned about capturing any individual player profile. If someone tells me I really ought to be looking at the median player in each round to capture an actual person, or that I ought to take the average wAV overall (rather than per season), maybe I’ll do so down the road. Also, while you would expect there to be differences in player/prospect quality at different draft slots within a particular round, the dataset I was working with probably isn’t big enough to go to that level of granularity.
Regardless, here’s what you get:

[Figure 2]
As you can see from Figure 2, on average, Round 1 picks perform better than later round picks regardless of position. But you can also see that the Round 1 wAVs are all over the place for different positions—for example, quarterbacks and running backs have relatively high Round 1 wAVs compared to cornerbacks and safeties (they all converge to zero in the later rounds, which makes sense given players drafted in the later rounds are less likely to have long, successful careers in the NFL).
That might be true, or it could simply be the result of how wAV is calculated (Pro Football Reference’s description of wAV makes clear that it is calculated differently for each position). Looking at the chart, I was skeptical that running backs were anywhere close to so valuable, so I wanted to make some adjustments to avoid simply capturing issues with the wAV metric being used. I decided to fix the starting points for each position around a consistent figure—the Round 1 average for each respective position. In other words, I set the Round 1 average to 1, and compared subsequent round averages to that figure. The effect is that QB wAVs get compared only to other QBs, edge rushers only to edge rushers, and safeties only to safeties, etc. That way, we can see how each position’s average wAV changes by round without having to worry too much about the differences in how wAV is calculated by position (it’s still baked in to an extent, but this is better).
The chart below shows the updated data, which I think is a bit clearer—it also shows the changes in player wAV by round for each position on the same scale, so cross-position comparison is more feasible.
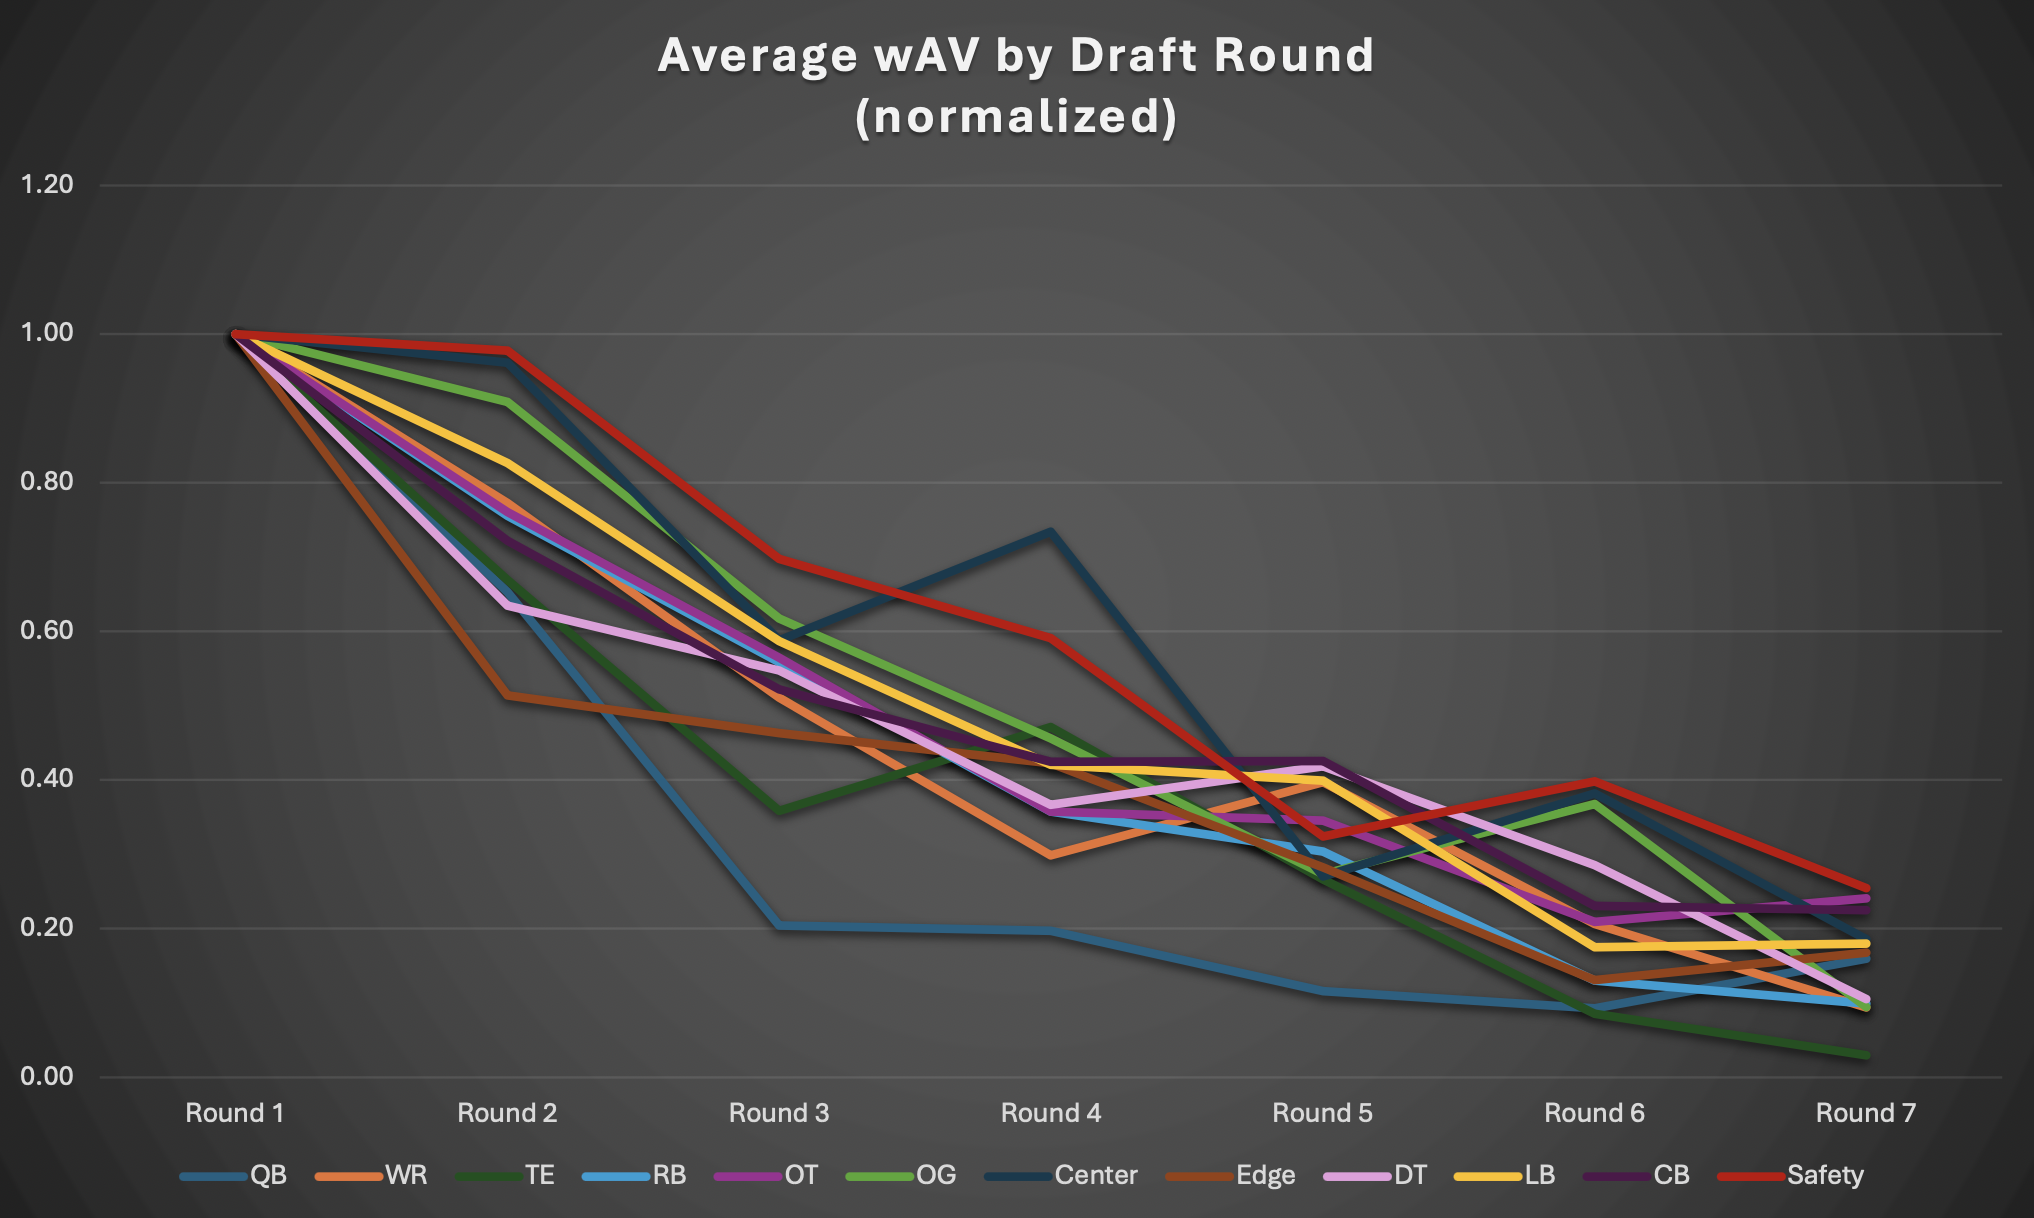
[Figure 3]
Of course, this isn’t to suggest that all positions start off with the same round 1 value. It’s still a little messy given the 12 positions shown on one graphic, but I like Figure 3 because it lets you see how the various positions compare on a similar scale.
For convenience, to show how each position changes by round, I’ve also included individual charts for each that show the same data in slightly easier-to-see bar chart formats below (figures 4, 5, and 6).

[Figure 4]

[Figure 5]

[Figure 6]
Given this is still a small-ish data set—remember, we’re looking at 10 years of drafts and somewhere between 80 and and 324 players drafted at any given position—it’s important not to read anything too dramatic from these charts. But there are a few general things that are reflected.
Surprise, Surprise! Good Quarterbacks Go Early
The most notable thing to me is the dramatic cliff that QBs seem to hit, both after the first round and again after the second round. QBs drafted in the second round are, on average, posting career wAV totals that are 35% lower than first round quarterbacks. And QBs drafted in rounds 3-7 are basically just a crapshoot—it barely makes a difference at all which round you draft them in, chances are they won’t be good. [Special shout out to Brock Purdy for basically single-handedly propping up the 7th round QBs in this data set.].
This trend makes a ton of sense given what conventional wisdom (and Figure 1 above) says about quarterbacks: they’re disproportionately valuable, and teams will reach to draft quarterbacks in the first round.
Coupled with the fact that quarterbacks are the highest value position in terms of compensation, the obvious conclusion is that teams are correct to use early draft assets on quarterbacks if they think they can play in the league. The chances of finding someone reliable after the first round drop off markedly, and after the second round, they drop even further.
Edge Rusher Production Falls Off Quickly After Round 1
I was pretty surprised at how huge the drop-off was for edge rusher performance outside the first round. On average, second round edge rushers produce just over half the wAV of their first round counterparts (51%), a full 12 percentage points bigger of a drop off than the next closest position, defensive tackle. That was unexpected enough that I went back and looked over the full list of 44 second round edge rushers and it makes some sense at a glance. The group is headlined by a few standouts with pretty successful careers like DeMarcus Lawrence and Preston Smith, but it also has a fair number of guys who flashed for a year or two and have otherwise not been consistent like Randy Gregory. Compare that to Round 1 (52 players), which has those same types of players plus multiple truly elite players in Khalil Mack, Nick Bosa, TJ Watt, and Myles Garrett (among others), and stand-out young players like Micah Parsons, Aidan Hutchinson, and Will Anderson. It certainly seems like the studs at edge are identified quickly by teams and pounced on in the first round.
Even though there’s a decent drop off after the first round, average production doesn’t change a ton between rounds 2 to 4. This could suggest that players who obviously have high-level NFL talent get identified properly and go in the first round, but that teams aren’t as good at sussing out the next tier of player who may be missing some ideal traits or need time to develop. It could also just mean there are a lot of players with below first round talent, so they can’t all go in the second round.
Regardless, the implication is that teams probably should focus on the first round if searching for top-end pass rushers. When you factor in that edge rusher is an extremely expensive position to fill in free agency, and that teams draft a high proportion of edge rushers early in the draft, the conclusion is even stronger. That said, teams probably should still be willing to draft edge rushers in rounds 2-4 based on their production—and given what we could distill from Figure 1, that’s exactly what they seem to do.
Defensive Tackles Also Drop Off After Round 1, But There’s Solid Middle Round Talent
After edge rushers, the biggest drop-off following round 1 is for defensive tackles, where the average wAV drops 37% in round 2. Once again, this is partly due to a handful of stellar defensive tackles who’ve been drafted in the first round in the last ten years, headlined by future Hall of Famer Aaron Donald as well as Jeffery Simmons, Dexter Lawrence, and Quinnen Williams.
But unlike with edge rushers, the talent level at defensive tackle appears to level off a bit longer. For edge rushers, after a big drop off after round 1, average wAV stayed pretty flat from round 2 to round 4. For defensive tackles, the decline isn’t quite as steep initially and things don’t stay quite as even, but the average wAV in round 5 stays at over 40% of round 1 (compared to 28% for edge rushers). In other words, there has often been useful players still available in the fourth and fifth rounds in drafts, which is relatively deep.
The relatively big drop-off in production from round 1 to round 2 amongst DTs runs against how teams appear to actually draft the position (Figure 1). Teams don’t seem to prioritize drafting DTs in round 1 or round 2 compared to other positions, even though there’s a big drop-off early and it’s the 4th most valuable position in terms of salary cap spending. That suggests the potential to find good value in drafting first round defensive tackles.
Little Advantage Drafting Interior OL, LB, and Safety Round 1
The charts for offensive guard, center, linebacker, and safety are kind of interesting. What stands out is how small the apparent advantage is of drafting these positions in the first round versus the second round. For centers, guards, and safeties, you’re talking about less than a 10% drop-off in average wAV; for linebackers, the drop off is a little bigger but still relatively small at 17%. This makes some sense if you think about the relative value of these positions on the free agency market. Generally, these are positions you can fill reasonably cheaply in free agency (though that is becoming less true for offensive guards), so seems teams aren’t going after talented players at these positions in the first round. That’s backed up by the actual draft results from Figure 1, which show between 6-9% of players for these positions being drafted in the first round.
Center and safety talent also looks to stay reasonably high even through the third and fourth round. There just isn’t the same drop-off in average wAV compared to the other positions, it’s much more gradual. For centers, this might be explainable by the fact that it’s a single position, so teams don’t need to draft tons of players at the position. That explanation doesn’t make as much sense for other positions, though, like with safeties and linebackers. For those positions, it’s possible that teams have a deeper pool of players to pull from—in fact, you often see NFL safeties and linebackers come from other positions at the college level, especially players coming from FCS programs.
I suspect part of what’s happening here is that teams are doing a reasonably good job of appropriately valuing these positions. They’re easier to fill in free agency, so teams don’t want to spend their most premium assets on these positions. But after the first round, the performance curve seems to be more similar to other positions.
WR, OT, and CB—All “Lower” High Value Positions In Free Agency—Follow A Similar Pattern
It’s interesting that wide receivers, offensive tackles, and cornerbacks seem to follow a similar path in value-decline-by-draft round. Here’s the percentage of first-round average wAV for each position for rounds 2-6:
Round 2: WR 77%; OT 76%; CB 72%
Round 3: WR 51%; OT 56%; CB 52%
Round 4: WR 30%; OT 36%; CB 42%
Round 5: WR 40%; OT 35%; CB 43%
Round 6: WR 21%; OT 21%; CB 23%
Round 7: WR 9%; OT 24%; CB 23%
Obviously round 7 wide receivers drop completely off, so stay away from them!
I wonder if this trend is roughly what you’d expect from a “normal” high value position (quarterbacks are definitely funky, and it looks like there really is a bigger drop-off for edge rushers and defensive tackles before a slow-ish taper). It’s a relatively consistent and probably reasonable decline for each round, with some hiccups of course. The drop-off from round 1 to round 2 isn’t nearly as stark as with QBs, edge rushers, and DTs, which makes a bit more sense intuitively—it’s not as though second round picks are seen as chopped liver by teams and draft analysts, many of them are considered high-level talents that need more development early on. At the same time, there is a clear difference in average performance between the first round and second round groups at these three positions, which is what you’d expect. For guards, centers, and safeties, it’s definitely weird that there is basically no real drop-off between round 1 and round 2.
It’s also worth noting there are more wide receivers and cornerbacks drafted in the last 10 years than any other position (324 and 322 respectively). So it would make some sense that data for those positions would be less prone to noise. On the other hand, you also see teams regularly going 4 or 5 deep at these positions in games, so even late-round draft picks are probably going to see the field for meaningful time and contribute.
Gut Check With Games Played
I’m not totally convinced that Pro Football Reference’s wAV metric is all that reliable, so it’s hard to know how valuable any of the inferences above are.
As a gut check, I wanted to find some other relatively simple, easy to obtain data to at least see if the trends above make conceptual sense, beyond applying general draft trends that I’ve seen from watching the draft every year myself and reading a lot of draft coverage (a truly preposterous amount).
The easiest thing I could think of is whether the number of games actually played changes at different rates for different positions based on draft round. For example, the wAV analysis above suggests there isn’t a huge difference between centers and guards drafted in the first round versus the second round, but do first round centers and guards play a similar number of games to second rounders? If that matches the wAV trend, I’ll be more inclined to think of wAV as a useful proxy for performance when looking at draft picks by round. In addition, looking at games played has the added benefit of incorporating subjective views of NFL teams regarding how their draft picks perform, as we can assume that teams like to play good players more often (probably? I’ll disregard a couple teams perhaps…go ahead and fill in who).
Figure 7 shows the average number of games played for players drafted in rounds 1-7 by position. Figure 8 shows the same information, but as I did with Figure 3 above, I set the average number of games played by first round picks at 1 and scaled the data accordingly so you can see the different trends together (I didn’t dive into this, but some positions have longer careers than others due to the nature of football—I wanted to look at the data without worrying too much about that).

[Figure 7]

[Figure 8]
Without diving too much into the details, the rough check of wAV versus games played actually looks pretty decent for wAV. You see some of the same trends.
For example:
There’s an enormous drop-off in average games played by quarterbacks drafted in round 2 versus round 1, and an even steeper drop-off after that. You can be pretty confident if you draft a quarterback in rounds 3 to 7 that they won’t play a lot, as they’re probably a full-time backup.
Safeties and linebackers drafted after round 1 continue to play a relatively high number of games compared to other positions. There’s some lumpiness in the data (round 2 linebackers apparently play a lot, and round 5 safeties apparently don’t get on the field much), but it’s pretty consistent with what we saw from wAV.
Centers also seem to play a high number of games, but there’s a weird dip for round 3. Given they’re the smallest group in terms of total numbers—only 14 centers were drafted in round 3 in the last 10 drafts—I’m not reading much into it.
Wide receivers and cornerbacks seem to follow a common trend again, and it looks like they could be the most representative. Offensive tackles depart a bit from them, however.
Other things don’t show up:
Edge rushers look to be following basically the same downward trend as the other positions—if you draft them later, they’re less likely to play as many games. But there isn’t a dramatic drop-off after round 1 like we saw for wAV. That doesn’t necessarily mean the trend showing up in the wAV analysis was wrong. For example, most teams play at least 3-4 edge rushers per game, so it’s possible that underperforming players still see the field enough to register. But it’s worth looking into a bit more.
Guards appear to suffer a pretty stark drop-off in average games played after round 3. We didn’t see a similar drop-off in the wAV analysis. It could be noise? No real obvious reason jumps out to me.
Let me know what else you see.
Sign-Off
That’s it for now! Let me know if you have any observations or thoughts in the comments or by email at duncan@thesportsappeal.com. I’m happy to look into more depth on any position!